Tangible Stats: Embodied and Multimodal Platform for Teaching Data and Statistics to Blind and Low-Vision Students
Danyang Fan (1), Gene SH Kim (1), Olivia Tomassetti( 1), Shloke N Patel (1), Victor R Lee (1), Sile O’Modhrain (2), Sean Follmer (1)
- Stanford University
- The University of Michigan
1 Motivation
Interactive data learning tools provide explorable ways for students to build intuition for data, data representations, and statistical measures. However, these tools are visually reliant and are often not accessible for blind and low-vision (BLV) students. In this work, we explore methods to better support non-visual learning of data and statistics.
2 Guiding Principles
Our team of blind and sighted students, educators, and researchers chose to emphasize four guiding principles to inform the design of a statistics learning platform.
We then ran a focus group with four experienced teachers of visually impaired students to gather additional insights about these principles.
- Principle 1: Encourage Active Exploration and Play
- Focus group insight: BLV students need opportunities to explore and figure things out themselves.
- Principle 2: Emphasize Intuition-Building
- Focus group insight: Concrete examples and familiar analogies help students learn abstract concepts.
- Focus group insight: Feedback assists students in internalizing causal relationships.
- Principle 3: Support Customization
- Focus group insight: Teachers often tailor materials to meet the individual needs of students.
- Focus group insight: New learning tools often need to be integrated into existing curricula.
- Principle 4: Provide Non-Visual Access
- Focus group insight: …while also enabling access for sighted students to promote collaborative and inclusive learning.
3 Learning Platform
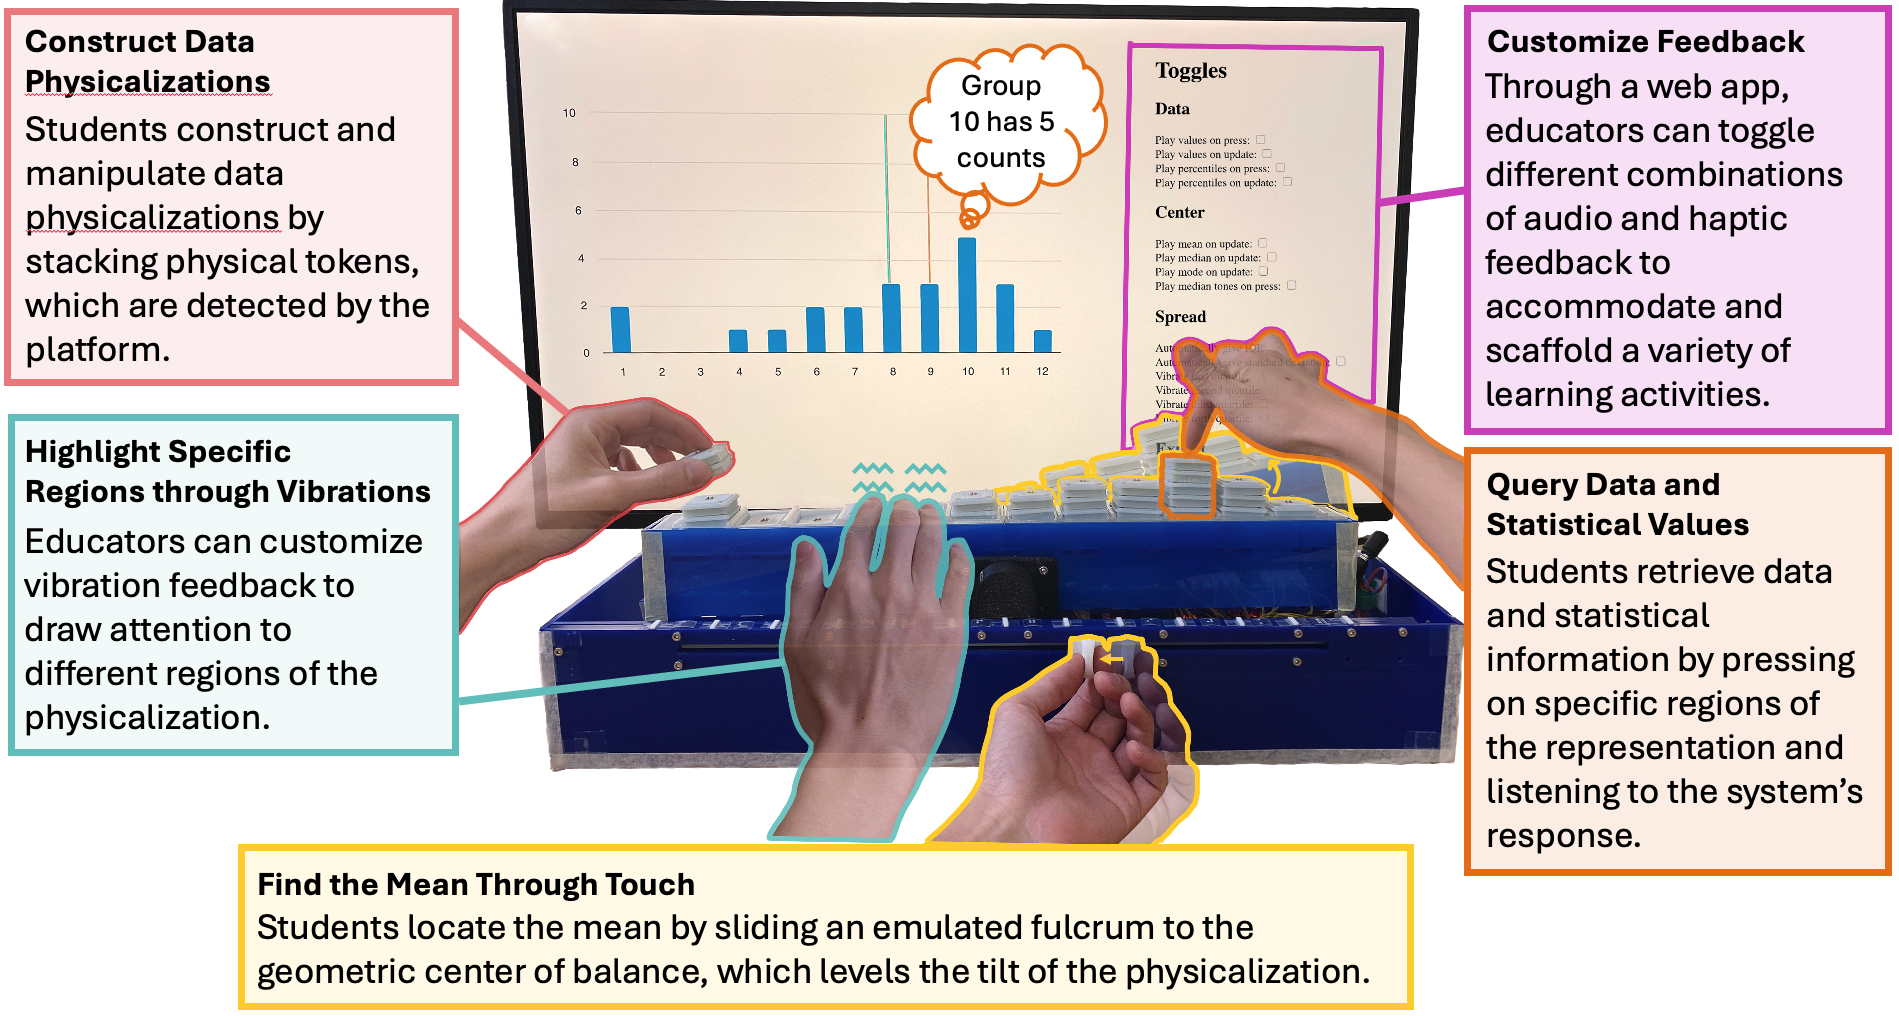
- Construct Data Physicalizations: Students construct and manipulate date physicalizations by stacking physical tokens, which are detected by the platform.
- Highlight Specific Regions through Vibrations: Educators can customize vibration feedback to draw attention to different regions of the physicalization.
- Find the Mean Through Touch: Students locate the mean by sliding an emulated fulcrum to the geometric center of balance, which levels the tilt of the physicalization.
- Query Data and Statistical Values: Students retrieve data and statistical information by pressing on specific regions of the representation and listening to the system’s response.
- Customize Feedback: Through a web app, educators can toggle different combinations of audio and haptic feedback to accommodate and scaffold a variety of learning activities.
4 Exploring Statistics Using Embodied Analogies
We explore the use of embodied analogies, which draw parallels between bodily experiences and abstract concepts, to help promote intuition of statistical measures.
4.1 Embodied Mean
The platform supports the analogy of center-of-balance to assist learners in developing intuition for statistical mean, illustrated through the following three figures:
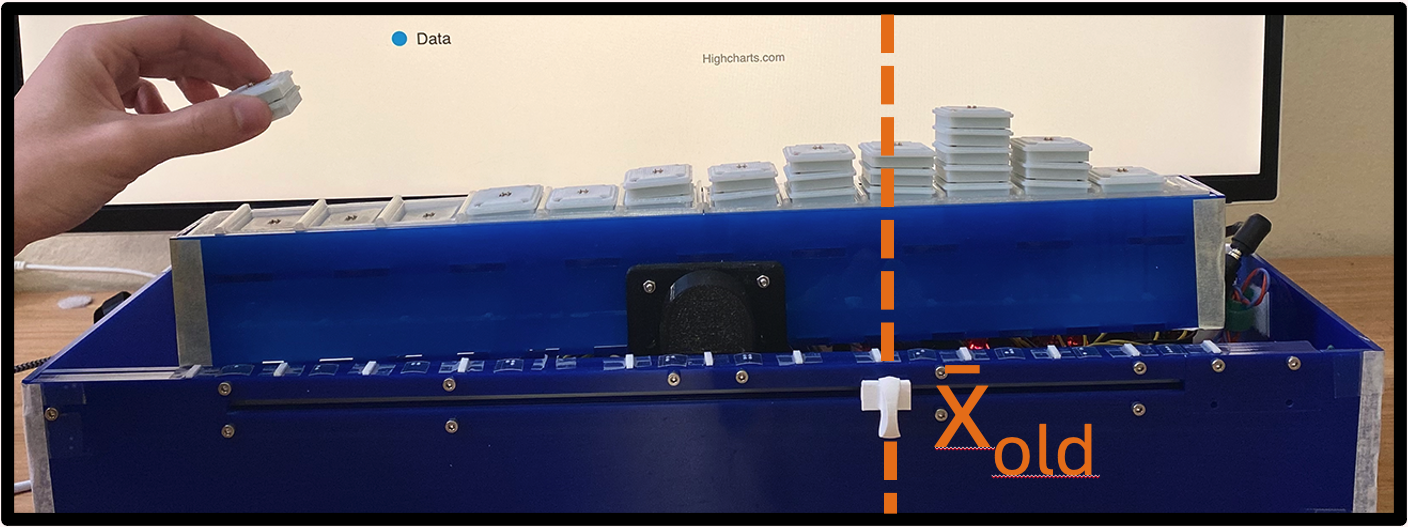 Figure 1: The physicalization is level when the emulated fulcrum is positioned at the statistical mean, which is the geometric center of balance.
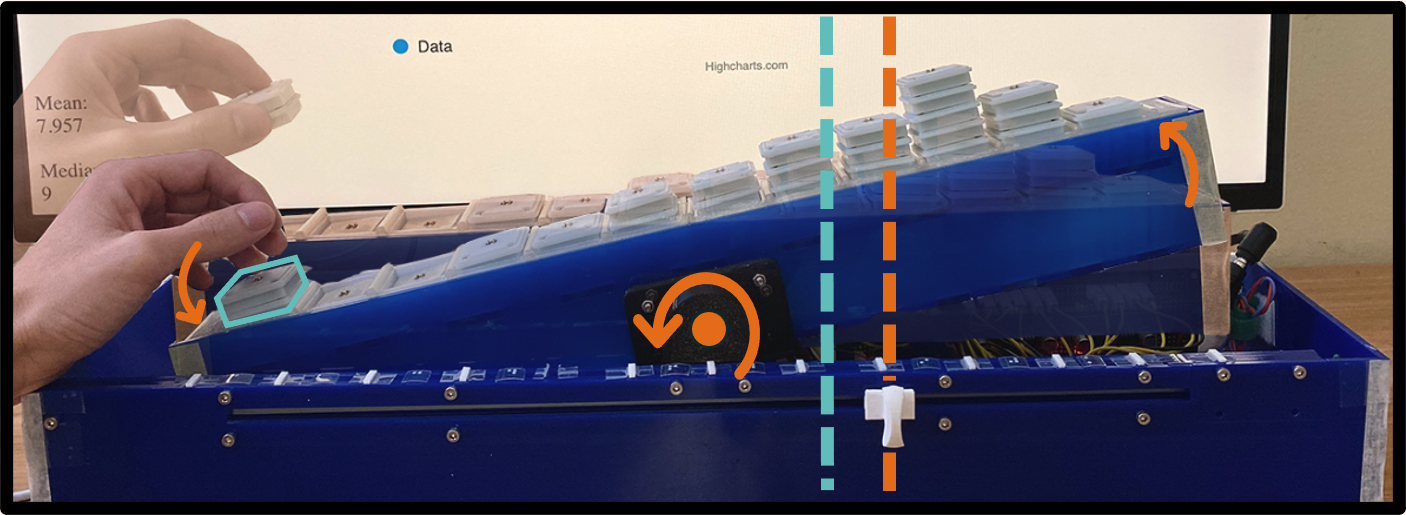 Figure 2: As students modify the data, they feel the impact of these modifications reflected in the board’s tilt toward the updated mean.
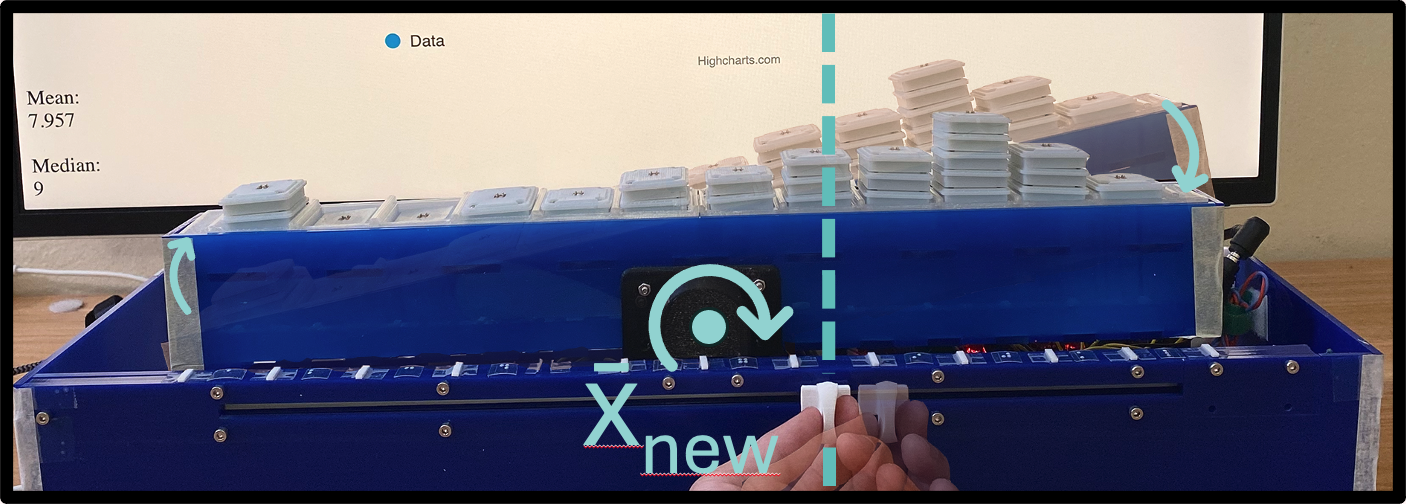 Figure 3: The distance students need to adjust the fulcrum to re-balance the mean physically demonstrates the sensitivity of the mean to the modifications.
4.2 Embodied Median
The platform also supports the interaction of exploring percentiles through feeling symmetry across the median, illustrated through the following figure:
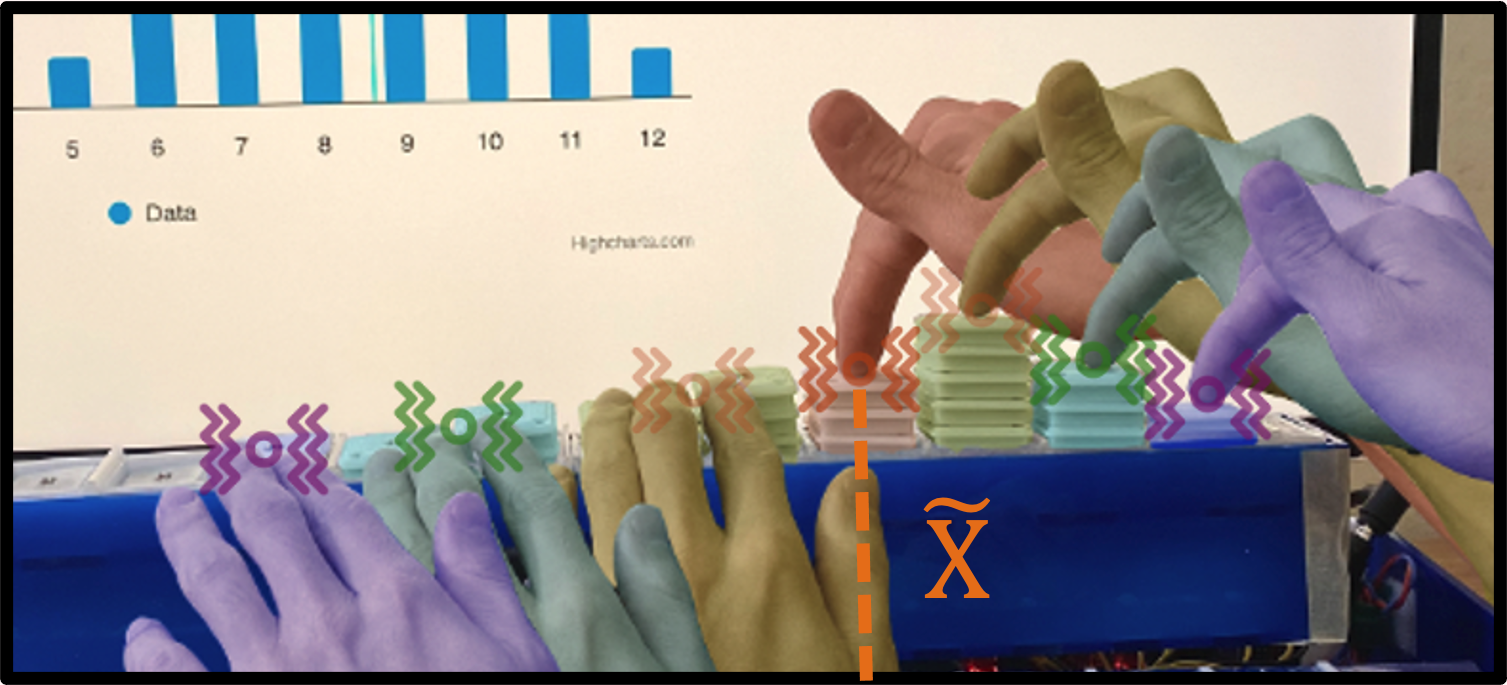 Figure 4: Students can press and hold token stacks to hear their percentiles spoken and feel vibrations from symmetric stacks mirrored across the median. Students can narrow in on the median by feeling vibrations converge using an outside-in approach.
You can learn more about our study through our paper titled: Tangible Stats: Embodied and Multimodal Platform for Teaching Data and Statistics to Blind and Low-Vision Students here.