Skip to Main Content
Toggle navigation
Accessible Data
Accessible Data
Tangible Stats
Tempo Sonification
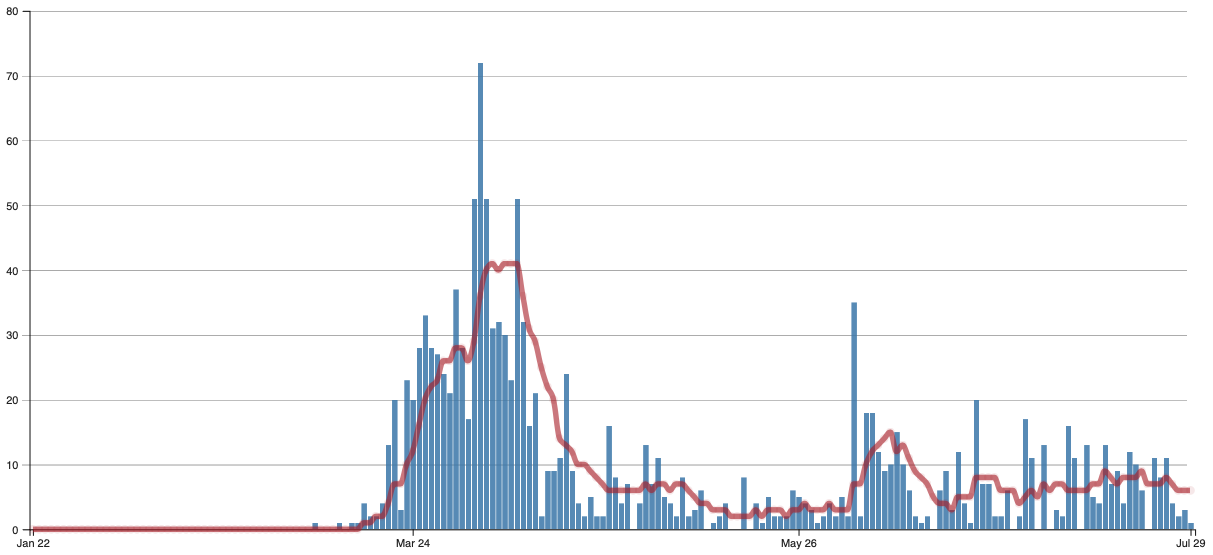
Daily Trends in Number of COVID-19 Cases in Vermont Reported to CDC
New Cases By Day
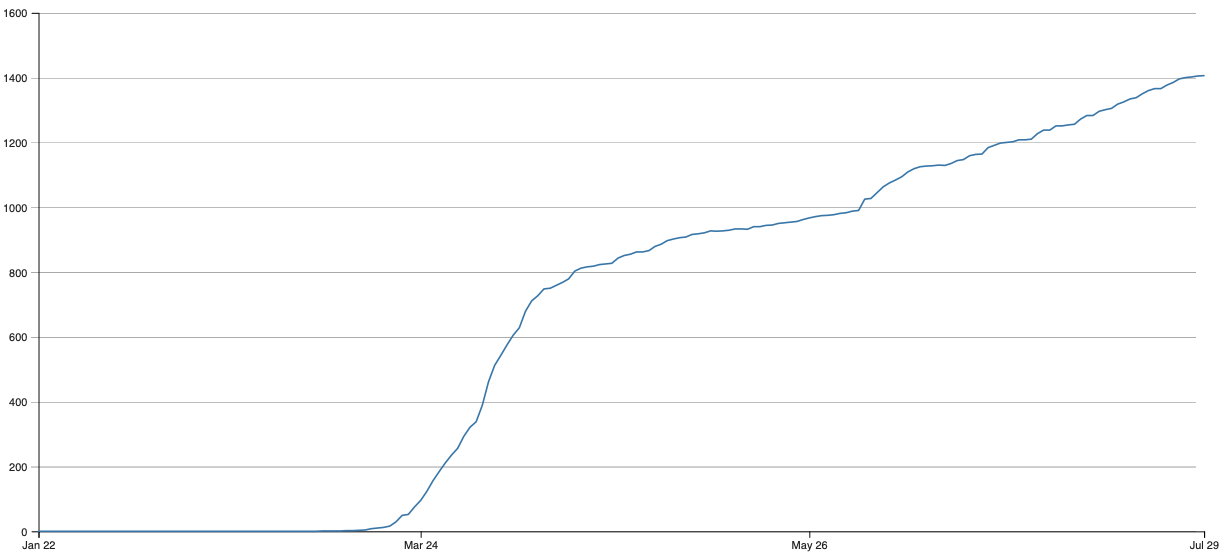
Total Cases
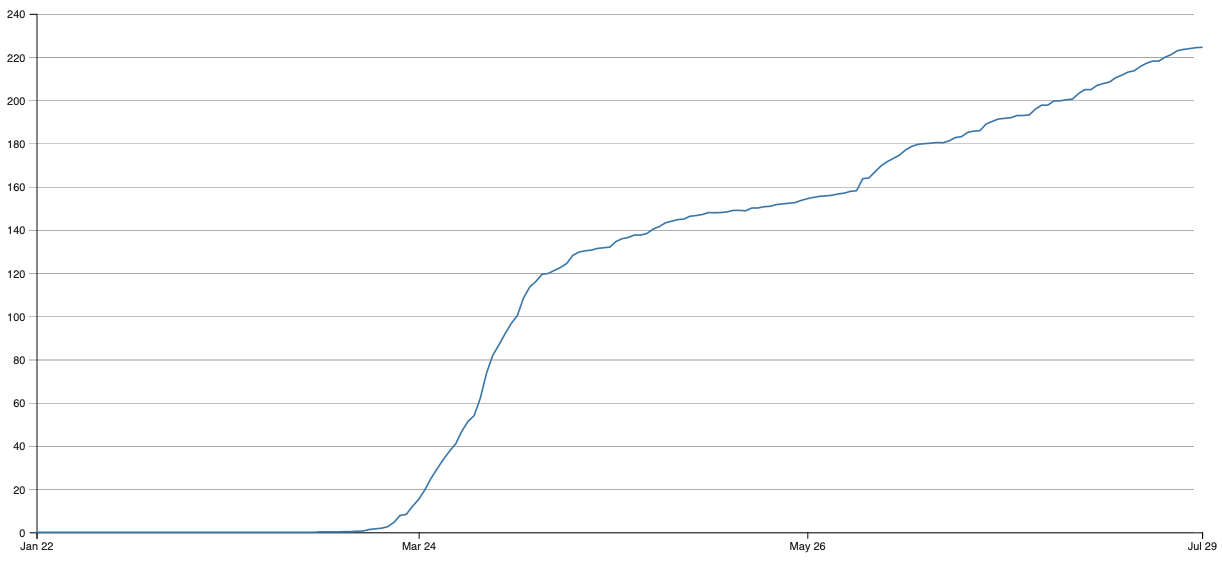
Total Rate per 100000
Browse the Dataset